
QUICK LINKS
RECENT PROJECTS
- THE EFFECT OF SEDIMENT DISTRIBUTION ON WATER FLOW USING A PHYSICAL SYSTEM AND COMPUTER MODEL
| The purpose of this study is to investigate how the flow of water through a hyporheic system is affected by the spatial distribution of the sediment as well as to build and validate a computer model of our system. We built a custom aquarium-like structure with a divide and two overflow levels, which could be filled with a grid of sands. The study was conducted by gathering time-lapse photos and electrolytic conductivity data as dyed salt water flowed through the physical system. This data compared favorably to simulations created using finite difference calculations in MODFLOW, calculations in MATLAB and visualizations in NetLogo. |

Dye traveling through a grid of sediments |
| Project Blog Poster | |

Caleb, Caleb, Susa, and Forrest after completing a long day of data collection....
- DESIGNING AND EVALUATING THE QUALITY AND COST-EFFECTIVENESS OF SATURATED SAND PERMEAMETERS
| A permeameter is an instrument used to measure hydraulic conductivity. Hydraulic conductivity (K) is defined as the ease with which a fluid can flow through pore spaces of sediment. Hydraulic conductivity affects the flow of water beneath and alongside a streambed, thus it is important to know a sediment’s saturated K value to model the hyporheic zone. There are two different categories of permeameters: falling-head permeameters and constant-head permeameters. Falling-head permeameters have a water level which drops, while constant-head permeameters have a constant flow of water through the system. The purpose of this study was to design a cost-effective permeameter as well as compare and evaluate the quality of other saturated sand permeameters. |

Caleb and Nicole testing a custom built permeameter |
DOCTORAL RESEARCH OVERVIEW
-
My dissertation research falls in the domain of computational geophysics with environmental applications. The goal of my research is to improve our understanding of the flow of water under and around riverine systems including the constant exchange of water between the surface and (a.k.a. hyporheic exchange). The purpose of this research is to better understand and thus be able to improve the water quality for the organisms (including people) which come into contact with these streams.
Specifically my research has focused on developing a three-dimensional model for solute transport through small stream systems and applying it to generated, natural, and theoretical systems in order to analyze how each scale of topographic feature contributes to river-groundwater interactions. As a means of collecting data for my simulations I have worked on several large-scale collaborative research projects with team members from the USGS and other universities. My model combines Fourier analysis, Schwarz-Christoffel conformal mappings, and finite difference calculations in order to determine subsurface stream flow based on easily measured system characteristics and the bathymetry of the system. I have also been involved in additional research projects, including imaging colloid deposition, mathematical analysis of noisy search processes, and fluorescence imaging of an arsenic hyperaccumulating fern.

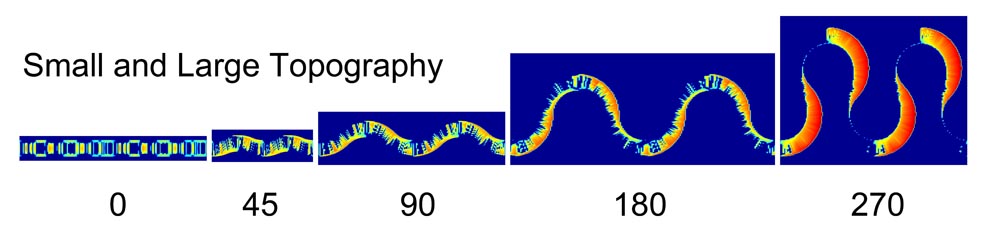
Multiple scales of feature drive hyporheic exchange
MODEL
|
The first part of this video shows 2D topography data being fit by sine curves. The second part shows each of these sine curves being shifted by a quarter wavelength to produce the head shape. |

Schwarz-Christoffel Conformal Mapping of Our 3D Flume Dataset
EXPERIMENTS
- LARGE-SCALE COLLABORATIVE DATA COLLECTION IN FLUVIAL SYSTEMS Data collection at field sites is a complex logistical problem. Many researchers are required and each researcher comes with different expectations and research interests. My first large-scale collaborative research experience was at the Eskilstuna Wetland in Sweden. I measured flow in a small channel and recorded areas of plant growth in collaboration with a Swedish university.
These collaborative experiences have allowed me to meet interesting people, learn experimental techniques, and expand my perspective of environmental research. This type of research has also given me the opportunity to supervise undergraduates in a variety of field work settings. |

Making measurements in Sugar Creek near Kentland, IN 
Set-up for measuring fine topography |

Subsurface sampling around a submerged log in Maple Creek near Nickerson, NE
|

Bedforms and dye in a laboratory flume |

Full view of laboratory flume at Northwestern
SIMULATIONS
- Contribution of Scales of Topography to Hyporheic Exchange The objective of this effort was to compare subsurface flow induced at scales ranging from very small-scale bedforms up to much larger planform geomorphic features such as meanders. The model was applied to two distinct flume datasets: one with primarily 2D features and one with a 3D grid of bathymetry data.
- Comparison of Model to Field Data with Groundwater Discharge The objective of this second study was to compare the subsurface flow predicted by our spectral model, solute tracer data, and transient storage model (TSM) predictions for a natural system. This comparison allowed me to draw conclusions about the time-scales of exchange captured in the traditional tracer studies. It was for this project that I was extended the spectral model to incorporate groundwater discharge. I was a member of a collaborative team with the USGS, which conducted a solute tracer experiment at Sugar Creek, a small ditched and straightened Midwestern stream.
- NONLINEAR INTERACTIONS BETWEEN MEANDERS AND BEDFORMS SIGNIFICANTLY AFFECT HYPORHEIC EXCHANGE The primary goal of this third study was to assess the relative contributions of sinuosity and small topography in the presence of varying volumetric flux and groundwater discharge levels. These simulations were all based on idealized topography with realistic ratios and flow conditions. The model used was the same spectral model described in the previous two studies. In this study, simulations were conducted on 5 different equiwidth streams with varying sinuosities in order to determine the effect sinuosity has on hyporheic exchange.
| Having spatially explicit information allowed me to evaluate the contributions of both gravitational- and current-driven hyporheic flow through various classes of stream channel features including ripples, dunes, and meanders. The model simulations indicate that all scales of topography between ripples and meanders have a significant effect on porewater flow fields and residence time distributions, but shallow exchange induced by current-driven interactions with small bedforms dominate the interfacial flux. Furthermore, complex interactions across the spectrum of topographic features play an important role in controlling the net interfacial flux and spatial distribution of hyporheic exchange. The key result from this work was demonstrating that simplified representations of the stream topography fall significantly short of representing the patterns and rates associated with hyporheic exchange. WRR 2010 Paper |

Simulated 2D particle paths based on a flume topography |

Simulated 3D particle paths based on a flume topography
| The model revealed a much broader range of time-scales than were reflected in the solute data or TSM approach. This is important for evaluating the range of spatial and temporal scales of solute transport behavior that are captured by the tracer injections and simulated by each model framework. Additionally I investigated the effects of varying groundwater discharge levels and the presence of dune and ripple scale topographic features. The simulations demonstrated a great reduction in hyporheic exchange in the presence of groundwater discharge, with the remaining exchange occurring towards the center of the stream where dunes and ripples were the largest. WRR 2012 Paper |

Sugar Creek near Kentland, IN |

Flux out of the subsurface with groundwater discharge

Generated topography with five sinuosities
Interfacial flux into the subsurface with no groundwater input
ADDITIONAL PROJECTS
- EFFECT OF HETEROGENEOUS HYDRAULIC CONDUCTIVITY DISTRIBUTIONS WITHIN PERMEAMETERS ON HYPORHEIC EXCHANGE I am working with a student to simulate the impact of noisey permeability distributions on hyporheic exchange. We are experimenting with different types of distributions and variability. The student presented part of the project at the 2014 National Conference on Undergraduate Research in Lexington, KY. NCUR 2014 Poster
- UNIQUE SOLVABILTY of THINK-TAC-TOE PUZZLES My husband and I worked with a high school senior on a mathematical research project focusing on a puzzle similar to mine-sweeper. The student presented part of the project at the Sixth Annual IL/IA ACS Undergraduate Research Conference at St. Ambrose.
- Stream Planform Identification Our goal was to create and evaluate methods of measuring accurate stream planforms. This is important for many purposes, including recording measurement and sampling locations, monitoring change due to erosion or volumetric discharge, and spatial modeling of stream processes. While expensive surveying equipment or high resolution aerial photography can sometimes be used to obtain this data, our research focused on evaluating inexpensive alternatives. At Black Hawk Creek (in Sunderbruch Park, Davenport, IA) we investigated five cost-effective methods of generating stream outlines.
- INVESTIGATING HYDRAULIC CONDUCTIVITY WITHIN PERMEAMETERS As part of St. Ambrose University's 2012 Summer Research Institute my group of three undergraduates spent their summer investigating hydraulic conductivity permeameter tests. Hydraulic conductivity (K) is an important sediment property related to the speed with which water flows through sediments. It affects hyporheic uptake and residence time distributions, which are critical to assessing solute transport and nutrient depletion
- EVOLVING TOPOGRAPHIES USING GENETIC ALGORITHMS In collaboration with Forrest Stonedahl we evolved topographies with a specific residence time distribution (RTD) using genetic algorithms. The genes of the genetic algorithm were the amplitudes and phase shifts corresponding to Fourier series that make up the topographies. We evaluated the topography's fitness by looking at how closely its generated RTD matched the goal RTD. The fitness value was then used to rank the topographies and they were then probabilistically selected by their fitness values to combine with other topographies, be copied into the next generation, or be mutated slightly. This eventually evolved topographies with very good RTDs.
- Think-Tac-Toe Think-tac-toe is a puzzle Forrest and I developed for our math problem solving students. We became interested in which sizes of puzzles were uniquley solvable (and were thus good puzzles.) We presented a proof of this at the summer MAA meeting (MathFest). The handout, abstract, presentation, which were developed for MathFest are linked to below.
- Sampling Repetition Heuristics in Noisy Landscapes with Fitness Caching For many large-scale combinatorial search/optimization problems, meta-heuristic algorithms face noisy objective functions, coupled with computationally expensive evaluation times. In this work the interaction between the technique of "fitness caching" and the straightforward noise reduction approach of "fitness averaging" by repeated sampling were investigated. Fitness caching changes how noise affects fitness landscapes, as noisy values become frozen in the cache.
- COLLOID DEPOSITION AND X-RAY DIFFERENCE MICROTOMOGRAPHY
- Fluorescence Imaging of a Hyperaccumulating Fern: Pteris Vittata
Mitch presenting at NCUR
ACS 2014 Poster

Katie presenting at the Sixth Annual IL/IA ACS Undergraduate Research Conference
| (1) We mapped the banks using the GPS feature in consumer-grade digital cameras. (2) We built a point-cloud using multi-view stereo software. We developed procedures for two direct measurement methods, (3) cross-sectional and (4) triangulation. We also developed (5) the ‘square method’, which was a novel photogrammetric procedure which involved floating a large wooden square on the creek, photographing the square and banks from as many angles as possible and then using the square to correct for perspective and extract the outline. |

The cross-sectional method |
| The post-processing of these pictures of the square involved first hand-marking the square corners, visible control points, and visible stream outline using the GIMP (image editor). We wrote an open-source GUI, which allows the user to load marked-up photos, designate square corners and label control points. The GUI also extracts the marked pixel coordinates from the images. We also wrote several scripts that correct the pixel coordinates for radial distortion using Brown's lens distortion model, correct for perspective by forcing the four square corner pixels to form a parallelogram in 3-space, and rotate the points in order to correctly orient all photos of the same square location. |
|
Planform data from multiple photos (and multiple square locations) are combined using
weighting functions that mitigate the error stemming from the markup-process, imperfect
camera calibration, etc. We have used our (beta) software to mark and process over 100
photos, yielding an average error of only 1.5% for the "square method". If you want to
know more about our project, click on the following links!
Project Blog Poster Time-lapse Video |

The 'square' method |

Forrest, Michelle, David, Kyle, and me after 12 hours in Black Hawk Creek (Sunderbruch Park, Davenport, IA)
|
in streams. In this study we investigated the effect of millimeter-scale K
variability on laboratory measurements made using the falling-head permeameter test, a typical in situ measurement technique. The vertical K
values and their variability were calculated for a variety of sands. We created composite
systems by layering these sands and measured their respective K values. Spatial head distributions for these composite systems
were modeled using the finite difference capability of MODFLOW with inputs of head levels, boundaries, and known localized K values.
These head distributions were then used to calculate the volumetric flow rate through the column, which was used in the Hvorslev
constant-head equation to calculate vertical K values. We found that these simulated system K values reproduced the same qualitative
trends as the laboratory measurements, and provided a good quantitative match in some cases.
Details about the project can be found on our poster or on our summer blog!
Project Blog Poster AGU Abstract |

Lab set-up 
Field work at Duck Creek |

Matt, Jessica, and David with their poster
Gecco Paper
Think-Tac-Toe Website MathFest 2011: Handout Abstract Presentation

Think-Tac-Toe puzzles
|
The goal of the
project was to develop heuristic
methods for predicting the optimal number of sampling
replications for fitness averaging assuming the use of fitness caching.
I derived two analytic measures for quantifying the effects of noise on a cached fitness
landscape (probabilities of creating "false switches" and
"false optima"). It was confirmed empirically that these measures
correlate well with observed probabilities on a set of four
well-known test-bed functions (sphere, Rosenbrock, Rastrigin,
Schwefel). Then I used four possible heuristic approaches for predicting the optimal
sampling and empirically investigated this using a random-mutation hill-climber with fitness
caching.
NICO Poster GECCO Paper |
Noise fluctuations on the sphere landscape |

False switch and false optima schematic. N represents noise and ε the difference between points.
|
A colloid is a substance containing evenly dispersed fine particles. Colloid deposition in porous media can affect flow through this substrate and thus affects the amount of hyporheic exchange present in a system. Colloids are not always innocuous, making their deposition patterns and rates of further interest. As part of a colloidal deposit imaging project, I ran column experiments depositing ZrO2 onto both sand and glass beads and collected microtomography images at Argonne National Laboratory’s Advanced Photon Source. Specifically, I used high resolution synchrotron-based X-ray computer microtomography (X-CMT) to locate the deposits and their relation to the porous medium.
AGU Poster GRL Paper |

Slice of a tomographic reconstruction of a column filled with glass beads |

Sand column at the tomography measurement station at the APS
|
The goal of this research was to explore methods of determining the concentrations
and form of arsenic in various areas of the pinnae of the Pteris Vittata, a fern, which hyperaccumulates
arsenic. X-ray fluorescence (XRF) data was collected in counts as the number of photons to be reflected to
the detector from a certain location over a specified amount of time. The peaks occur where the sample
encounters a large amount of arsenic and the valleys represent areas containing less arsenic.
This data was collected at a synchrotron facility by focusing the beam with Kumakhov polycapillary
lens in order to improve image resolution of the arsenic in the fern’s pinnae.
APS User Activity Report |

Fluorescence image of arsenic in a fern pinnae |

APS fluorescence and transmission raster scanning set-up